Features
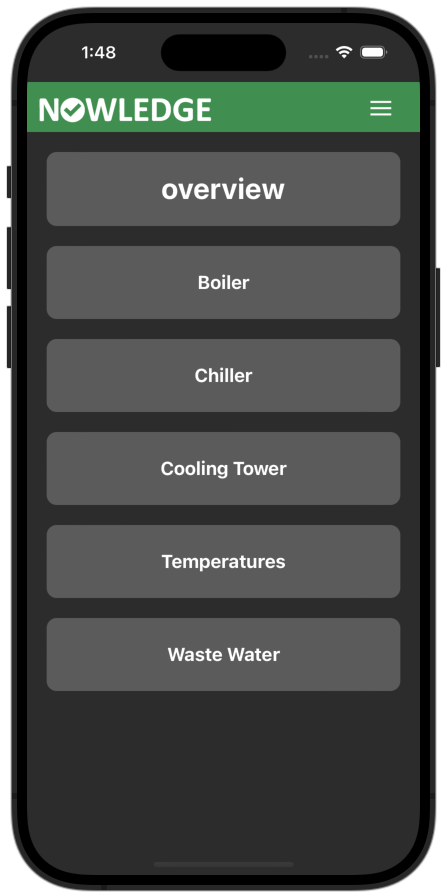

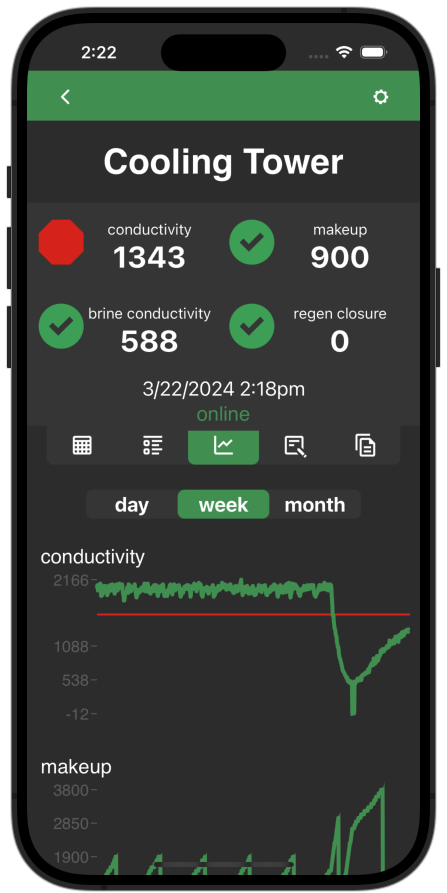
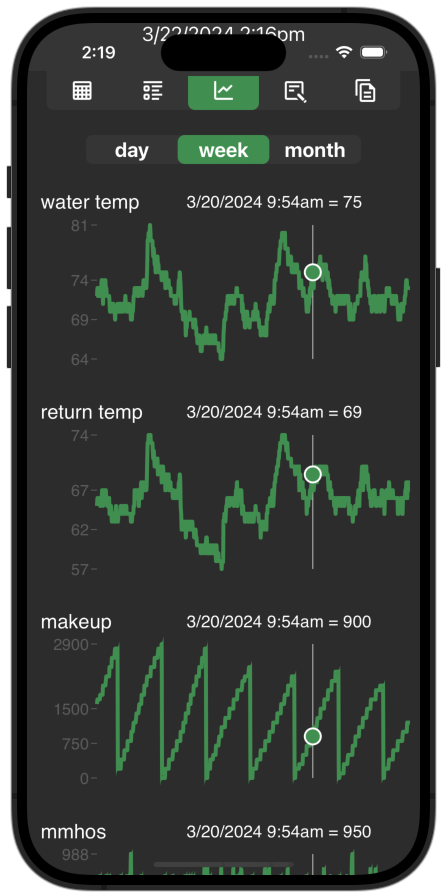
The main screen is your home screen. This will be a list of all the devices within your organization. Click the device to go to its individual data page. The next screen is called the overview. The overview looks over your accounts for you. It will show you any of the devices within your organization are in alarm, notes posted to any accounts and if any of the devices have gone offline. If you click on a devices button you are taken to that devices main page. Current readings are displayed here with five icons to contain all the collected data for that device/system. The first icon is to view your collected data as graphs. You can choose to view the week, the month or choose an individual day to take a closer look.
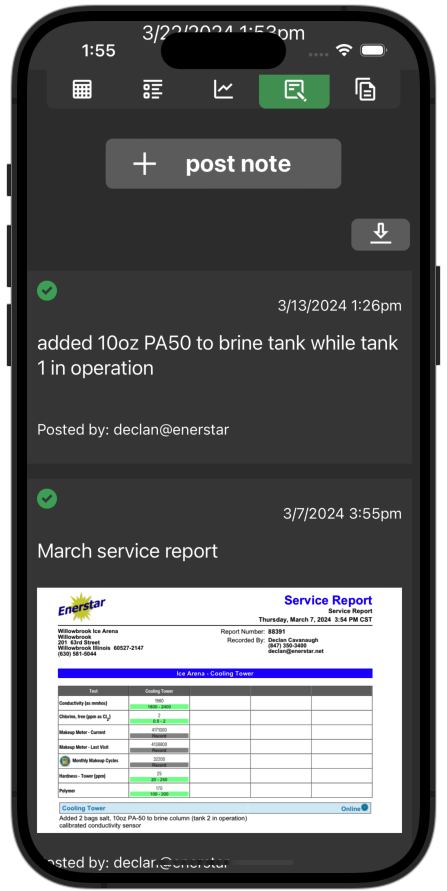


The next feature is the notes section. Post any notes you have on that system here. This includes pictures so you can show the system or post up a service report. There is a documents section at all to post any relevant documents. Quickly tap and download them whenever needed. Most file types are supported. The logs section will list out an alarms and their timestamps. The spreadsheet is used to access data through out the devices history. Select a time range or create a custom spreadsheet by selecting a timerange and readings. Perfect for doing deep analysis on a system.